In the world of trading, chart patterns are like a roadmap, guiding traders on potential market movements. They can be incredibly useful for predicting future price actions and making informed trading decisions. If you’re new to trading or just looking to brush up on your knowledge, understanding different types of chart patterns is essential. In this guide, we’ll break down the most common patterns, explain what they mean, and show you how to use them effectively.
it’s here Financial Tips Before 20s has to know.
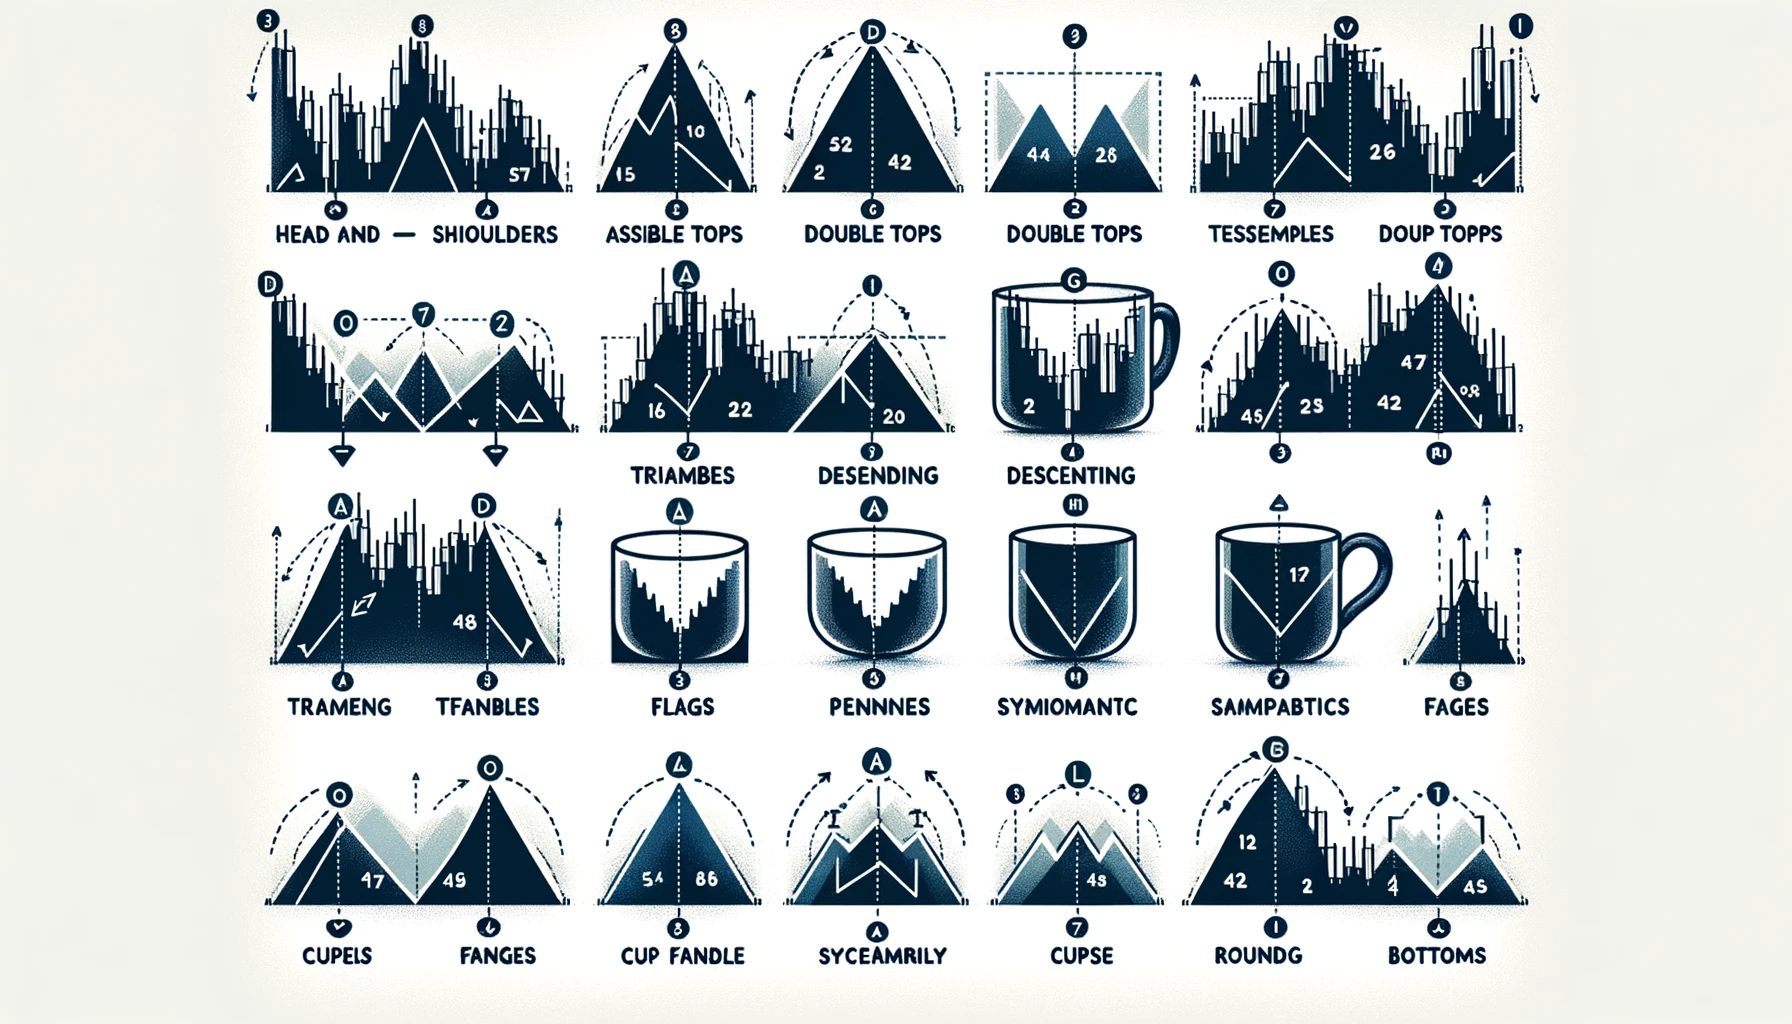
Head and Shoulders Pattern
One of the most well-known chart patterns, the head and shoulders pattern, indicates a reversal in trend. It consists of three peaks: a higher middle peak (the head) between two lower peaks (the shoulders). Here’s how it works:
- Left Shoulder: Price rises, then falls.
- Head: Price rises again, forming a higher peak, then falls.
- Right Shoulder: Price rises once more but doesn’t reach the head’s height before falling again.
When the price breaks below the neckline (a line drawn through the lowest points of the shoulders), it suggests a bearish reversal, indicating that prices might fall further.
Double Tops and Double Bottoms
These patterns also signal trend reversals. They are simpler than the head and shoulders pattern, making them easier to spot.
- Double Top: Resembles the letter ‘M’. Price reaches a high point, falls, rises again to a similar high, and then drops.
- Double Bottom: Resembles the letter ‘W’. Price falls to a low, rises, drops to a similar low, and then climbs.
Both patterns suggest that the previous trend is losing strength and a reversal is likely.
Triangles
Triangles are continuation patterns that show a pause in the market trend before it continues in the same direction. There are three main types of triangles:
- Ascending Triangle: Formed by a horizontal resistance line and an upward-sloping support line. It indicates a bullish trend continuation.
- Descending Triangle: Formed by a horizontal support line and a downward-sloping resistance line. It signals a bearish trend continuation.
- Symmetrical Triangle: Formed by two converging trend lines, where the direction of the breakout determines the trend’s continuation.
Flags and Pennants
These short-term continuation patterns indicate brief consolidations before the trend resumes.
- Flag: A small rectangular pattern that slopes against the prevailing trend. It forms after a sharp price movement and typically signals a continuation in the same direction.
- Pennant: Similar to a flag but shaped like a small symmetrical triangle. It also forms after a significant price move and suggests a continuation of the trend.
Wedges
Wedges indicate a reversal or continuation, depending on their direction and position within the trend.
- Rising Wedge: Formed by upward-sloping support and resistance lines. It typically signals a bearish reversal.
- Falling Wedge: Formed by downward-sloping support and resistance lines. It usually suggests a bullish reversal.
Cup and Handle
This bullish continuation pattern resembles a tea cup. It starts with a rounded bottom (the cup), followed by a smaller consolidation (the handle).
- Cup: Price declines gradually, forms a rounded bottom, and then rises back to the original level.
- Handle: After the cup, the price moves sideways or slightly downward before breaking out upwards.
Rounding Bottoms
Also known as saucer bottoms, these patterns indicate a gradual shift from a downtrend to an uptrend. They form a U-shape and suggest a long-term bullish reversal.
Trading vs Investing in the Stock Market need to
Conclusion
Understanding these chart patterns can significantly enhance your trading strategy. By recognizing these patterns, you can predict potential market movements and make more informed decisions. Keep practicing and studying these patterns, and over time, you’ll get better at spotting them and using them to your advantage.

