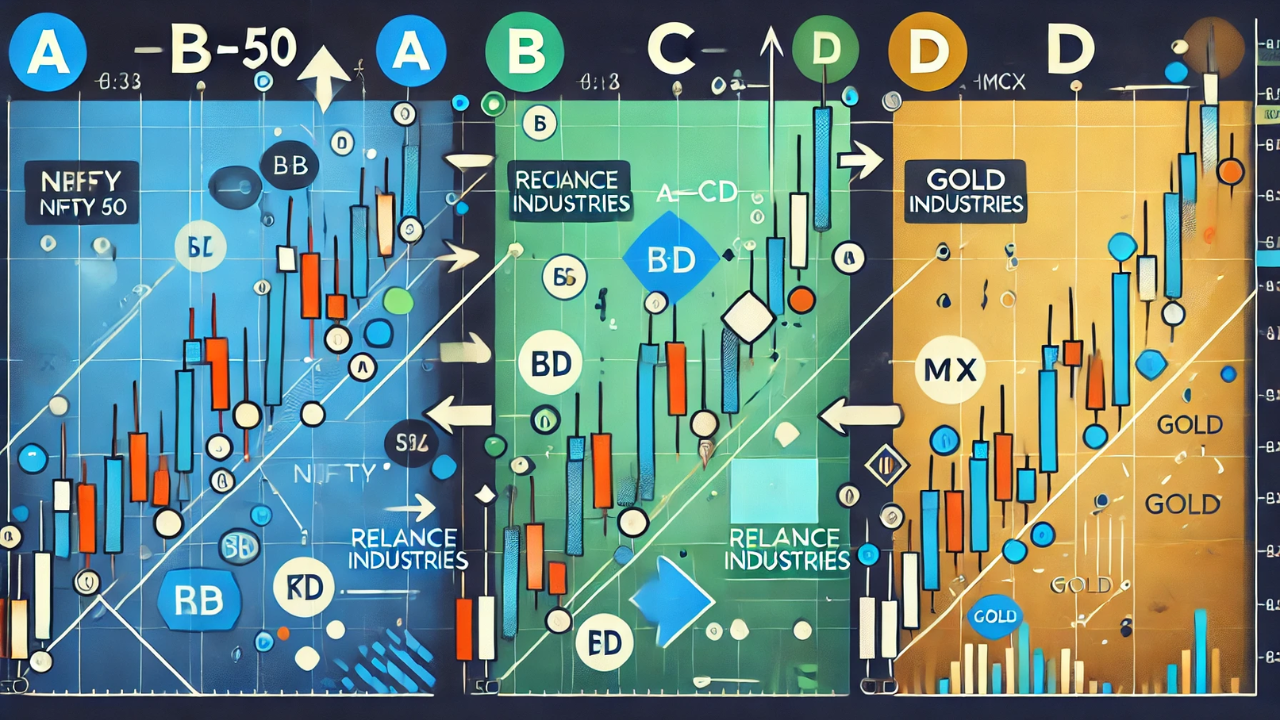
Trading in the financial markets can often seem like deciphering a complex puzzle. Among the many tools traders use to make sense of market movements, the AB=CD pattern stands out for its simplicity and reliability. In this blog, we’ll explore what the AB=CD pattern is, how it works, and examine several case studies from the Indian market to see it in action.
What is the AB=CD Pattern?
The AB=CD pattern is a classic chart pattern used in technical analysis. It’s a four-point pattern that helps traders identify potential reversal zones in the market. Here’s a simple breakdown of the pattern:
- Point A to Point B: The initial leg up or down.
- Point B to Point C: A retracement or correction.
- Point C to Point D: A move that mirrors the length and magnitude of AB, completing the pattern.
The key idea is that the distance (in terms of price and time) from A to B should be roughly equal to the distance from C to D.
Why is the AB=CD Pattern Important?
This pattern is valuable because it provides a clear framework for identifying potential reversals. It allows traders to set entry and exit points, manage risk, and make more informed trading decisions.
Case Study 1: AB=CD Pattern in Nifty 50
Let’s look at a real-world example in the Indian stock market using the Nifty 50 index.
- Point A (16,000 INR) to Point B (16,800 INR): The index rises by 800 points.
- Point B (16,800 INR) to Point C (16,400 INR): A correction happens, retracing 50% of the initial move.
- Point C (16,400 INR) to Point D (17,200 INR): The index rises again by 800 points, mirroring the initial move from A to B.
In this case, once the pattern is identified at Point C, a trader could anticipate the move to Point D and place a buy order, setting a target around 17,200 INR.
Case Study 2: AB=CD Pattern in Reliance Industries
Next, let’s consider a scenario with Reliance Industries Ltd (RELIANCE).
- Point A (2,000 INR) to Point B (2,200 INR): The stock price rises by 200 INR.
- Point B (2,200 INR) to Point C (2,100 INR): A correction occurs, retracing 50% of the initial move.
- Point C (2,100 INR) to Point D (2,300 INR): The stock rises again by 200 INR, completing the pattern.
Upon recognizing this pattern at Point C, a trader might decide to go long on RELIANCE, targeting a price of 2,300 INR.
Case Study 3: AB=CD Pattern in Gold (MCX)
Finally, let’s explore a case study in commodity trading, specifically gold on the Multi Commodity Exchange (MCX).
- Point A (48,000 INR) to Point B (49,000 INR): Gold prices increase by 1,000 INR.
- Point B (49,000 INR) to Point C (48,500 INR): A correction occurs, retracing 50% of the initial move.
- Point C (48,500 INR) to Point D (49,500 INR): Gold prices rise by 1,000 INR, completing the pattern.
A trader recognizing this pattern at Point C could buy gold futures, aiming for a target price of 49,500 INR.
It’s here Understanding Types of Chart Patterns need to know
Tips for Trading the AB=CD Pattern
- Confirm with Other Indicators: Use additional technical indicators like RSI or MACD to confirm the pattern.
- Set Clear Targets: Have defined entry and exit points to manage risk effectively.
- Practice Makes Perfect: Use demo accounts to practice identifying and trading the AB=CD pattern.
FAQs
How reliable is the AB=CD pattern?
While it’s a popular and reliable pattern, no pattern guarantees success. It’s essential to use it alongside other tools and analysis.
Can the AB=CD pattern be used in all markets?
Yes, it’s versatile and can be applied to forex, stocks, commodities, and even cryptocurrencies.
What time frames work best for the AB=CD pattern?
It works across various time frames, but it’s often more reliable on higher time frames like daily or weekly charts.
Wrapping Up
The AB=CD pattern is a powerful tool for traders looking to identify potential market reversals. By understanding its mechanics and applying it through real-world examples from the Indian market, traders can enhance their strategies and potentially improve their trading outcomes. Remember, like all trading tools, it’s most effective when used as part of a broader trading plan.

